“GDP” and “Nikkei 225” are often mentioned in the economy and investment. I will briefly explain what is the difference between Japan’s GDP and the Nikkei 225, and use historical statistical data to examine how these two work together.
What is GDP
GDP is an abbreviation for Gross Domestic Product and is also called Gross Domestic Product. Generally, it means the added value of goods and services newly created in Japan within a certain period. Simply put, it is an indicator of how active domestic economic activities are by producing goodsand providing services.
GDP can be viewed from the three perspectives of “production,” “distribution,” and “expenditure,” which are equal. This is called the three-sided equivalence principle. The following figure shows a simple example. It simply illustrates the cycle in which the money earned by a company producing goods is distributed to workers, and the company produces it by spending it by individuals. Here, “production” = “distribution” = “expenditure” is roughly established.
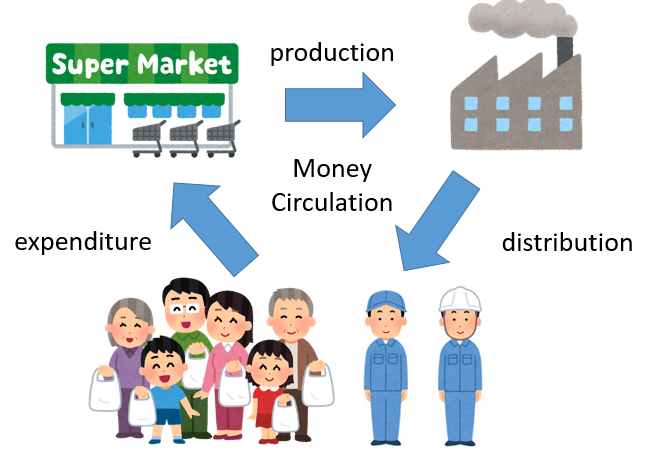
GDP is also said to indicate the wealth of a country. High GDP means that there is a large amount of money circulated in production, distribution, and expenditure, which means that many things are produced and many things are consumed. In simple terms, I think it would be richer if we could create a cycle that satisfied many demands and supplies so that the products we made sell quickly and we get what we want.
What is the Nikkei 225?
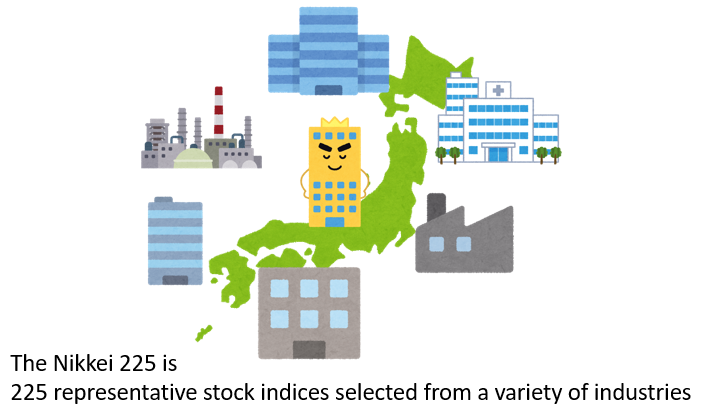
The Nikkei 225 is a stock index calculated based on the stock price of 225 representative stocks selected from about 2,000 stocks listed on the first section of the Tokyo Stock Exchange.
The representative 225 stocks are selected from all industries in a well-balanced manner, with stocks with high trading volume in order to maintain indexability. Therefore, it can be considered as an all-star, which is a collection of famous companies representing Japan from various industries. In other words, the Nikkei 225 is an index that tries to evaluate the stock price of Japan as a whole by collecting the stock prices of these representative companies.
Difference between GDP and Nikkei Stock Average
GDP and Nikkei 225 are the same in that they are one of the indicators to evaluate economic activity in Japan, but the data and the calculation method they focus on are different.
The biggest difference is that GDP is calculated using the results of actual economic activity (past), while the Nikkei 225 stock price growth (future) is the decisive factor for fluctuations in value. In other words, it can be said that GDP shows past results so far, and the Nikkei 225 stock price shows future expectations. In this way, the time axis that we are particularly focusing on is different, and the calculation method is also completely different, but in any case, both are considered to be used as indicators to evaluate current economic activity.
Correlation between Japanese GDP and Nikkei 225
In fact, we will compare the changes in GDP and Nikkei 225 so far, and consider their correlation to see how they are linked.
The figures are compared for each year from 1994 to 2019. For the Nikkei 225, the average of the daily closing prices is calculated as the value of the Nikkei 225 for one year. The idea of averaging the Nikkei 225, which fluctuates significantly every day, may not be so accurate, but here I am trying to force a simple comparison with GDP. In addition, GDP uses real GDP.
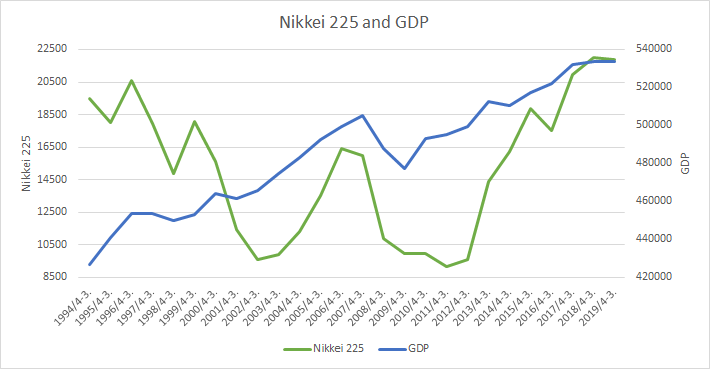
Nikkei 225 Index : Macrotrends Home Page : Nikkei 225 Index – 67 Year Historical Chart (from www.macrotrends.net)
If you look at the two increases and decreases in the graph, the undulations seem to work together.
The Pearson’s correlation coefficient of the two values for the 26 years from 1994 to 2019 is 0.17 (result of almost no correlation).
(that?Does it seem to work a little?)
If I use Pearson’s correlation coefficient here, GDP will focus on the gradual increase trend (trend) for 26 years, and no correlation will appear for detailed price movements. In other words, all we have learned here is that the big move in 30 years is that the Nikkei 225 and GDP are hardly linked.
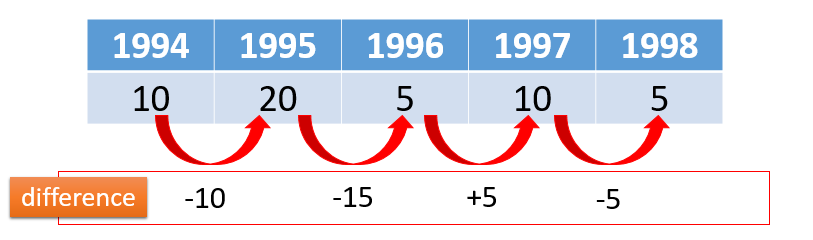
Therefore, the difference between floors is used to examine the correlation with the short-term increase or decrease of time series data such as Nikkei 225 or GDP. The difference is the next value in the time series minus the previous value, indicating the increase or decrease before and after. It can be used to make comparisons that focus on short-term changes rather than long-term gradual changes.
Nikkei 225 Index : Macrotrends Home Page : Nikkei 225 Index – 67 Year Historical Chart (from www.macrotrends.net)
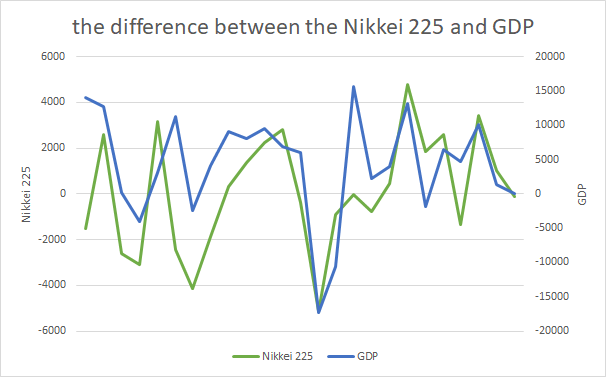
If you plot the difference between the Nikkei 225 and GDP, it seems that the two values are more linked.
The Pearson’s correlation coefficient between the two values was 0.55 (result of a certain degree of correlation). The test result was also significant.
Summary
Both the Nikkei 225 and GDP are used as one of the indicators to evaluate Japanese economic activity, but their calculation methods are completely different. As a result of examining how much the two are actually linked using statistical data, it was found that there is a correlation between the Nikkei 225 and the short-term price movement of GDP.