Financial Planner

スポンサーリンク
Financial Planner

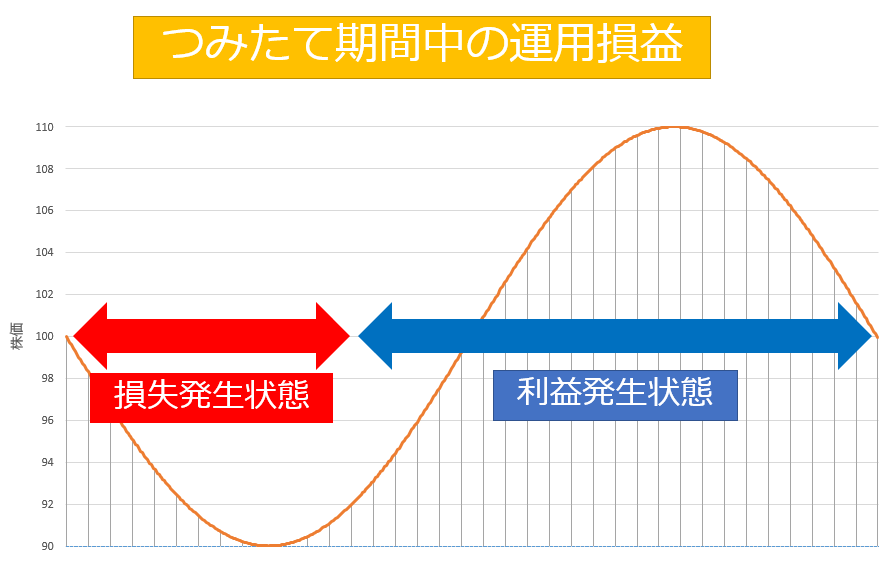
[Illustration] Verification of the effect of time variance of investment (dollar cost average method)

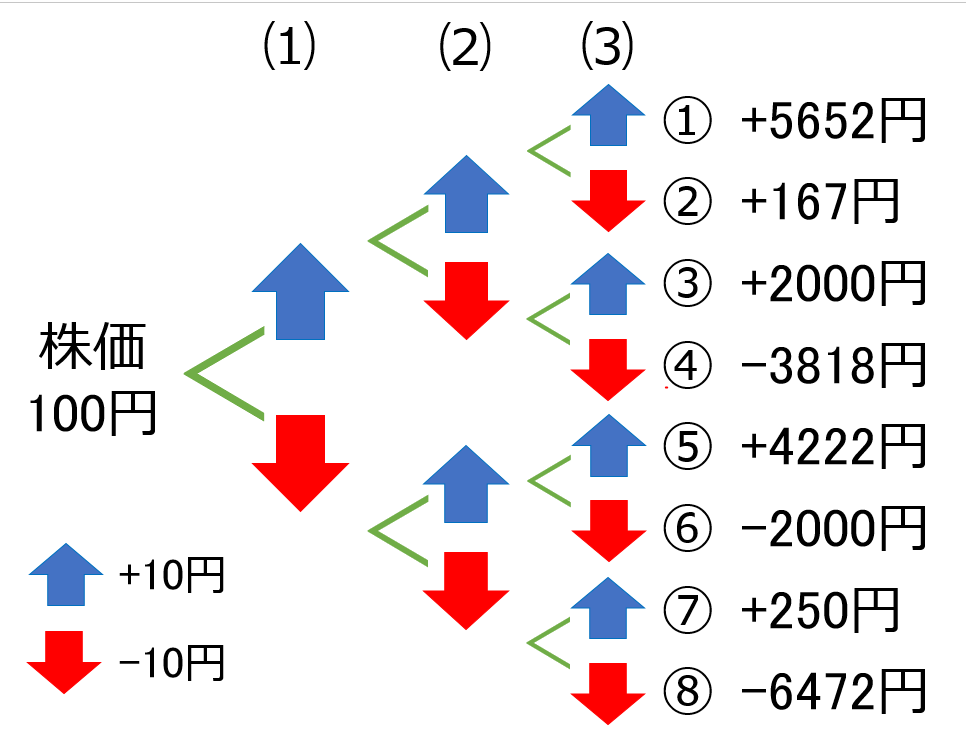
"Time dispersion" is one of the ways to reduce the risk of investment. It is also called the dollar cost ad average method. I will actually illustrate through simulation what kind of profit and loss will occur when stock prices move against this method realized by investing.
2022.11.13
FP2 level

Understanding the Law on Financial Transactions

I will explain the Financial Instruments Sales Law, the Financial Instruments and Exchange Act, the Consumer Contract Act, and the Act on Prevention of Transfer of Criminal Proceeds, which are the acts related to the transaction of financial instruments, in a diagram that is easy to remember.
2022.11.13
FP2 level

Taxation of various financial products

This section explains the classification of taxes on various financial instruments.
2020.10.10
FP2 level

[Illustration] Derivatives: Easy understanding of the mechanisms of futures trading, option trading, and swap trading

I will explain futures trading, option trading, and swap trading which are derivatives (financial derivatives) in an easy-to-understand manner. The purpose is to understand why such a difficult thing exists, and to remember the image of each outline.
2020.10.02
Financial Planner

Bond Investment Trusts: MMF and MRF Are Deposit Products of Securities Companies

MMF and MRF are typical products of public and corporate bond investment trusts. I will explain what these are and what the difference is from other products.
2020.09.28
FP2 level

Illustration: Understanding the structure and classification of investment trust

I will explain what an investment trust is, what structure it is, and what kind of classification it is. This is a field that has a lot of technical applications, but it is remembered by images by easy-to-remember illustrations.
2020.09.21
Financial Planner

Illustration: Demonstrate the effect of the dollar cost averaging with specific examples

Dollar cost averaging is a method of investing a certain amount on a regular basis, and it is said that the purchase price can be kept low on average in a changing price. Here, I will illustrate how effective it actually is, using specific examples.
Financial Planner

Grasp the ”Financial Crisis” in one minute by illustration

A brief diagram explains what happened to Financial Crisis and what was the cause.
2020.09.16
Financial Planner

How much Japan’s GDP and Nikkei 225 are linked

"GDP" and "Nikkei 225" are often mentioned in the economy and investment. I will briefly explain what is the difference...
2020.09.16
FP2 level

Indicators of equity investment: RER, PBR, ROE, dividend yield, dividend payout

I will illustrate the differences and characteristics of RER, PBR, ROE, dividend yield, and dividend payout, which are indicators of equity investment. Let's understand it by the image including how to remember it.
スポンサーリンク
タイトルとURLをコピーしました