“Time dispersion” is one of the ways to reduce the risk of investment. It is also called the dollar cost ad average method. I will actually illustrate through simulation what kind of profit and loss will occur when stock prices move against this method realized by investing.
The difference between a bulk purchase for a simple price movement and a new one is explained in the following article.
This time, I would like to look at the effect of the new work and the profit and loss of the operation from a viewpoint a little different from the above article.
Effect of time variance “build-up”
In this simulation, the first stock price is set at about 100 yen per share, assuming a movement to return to the first stock price at the end after a change of within plus or minus 20 yen, and in that price movement, I will set it up for three years by 10,000 yen each month. In other words, the investment amount will be 360,000 yen in total, and if you buy it in bulk and sell it in bulk at the end, the profit and loss will be 0.
We will consider what kind of profit and loss will ultimately be caused by the fresh effect, and what kind of profit and loss will occur during the period.
Price Movement Pattern 1: Sign Curve
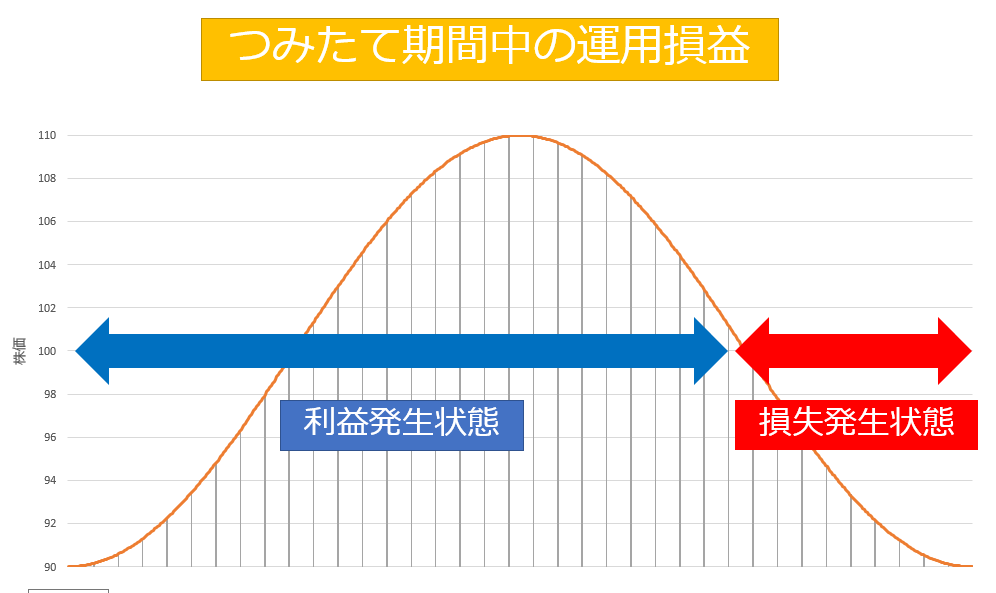
As shown below, let’s assume a price movement like a sign curve that comes down after going up and returns to the end.
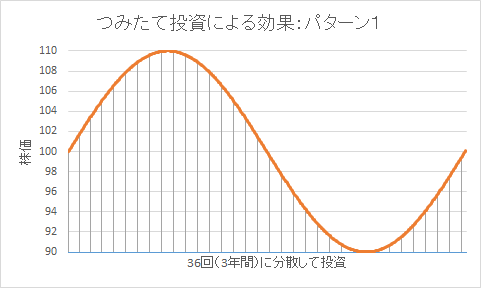
The following table summarizes the stock price at the time of each purchase of 36 times and the number of shares purchased accordingly.
| Number of purchases | Stock | Number of shares that can be bought for 10,000 yen | Amount of investment | Value of the rating | Income |
| 1 | 100.0 | 100.0 | 10,000. | 10,000. | 0 |
| 2 | 101.8 | 98.3 | 20,000 | 20,178 | 178 |
| 3 | 103.5 | 96.6 | 30,000 | 30,520 | 520 |
| 4 | 105.1 | 95.1 | 40,000 | 40,995 | 995 |
| 5 | 106.6 | 93.8 | 50,000 | 51,560 | 1,560 |
| 6 | 107.8 | 92.8 | 60,000 | 62,159 | 2,159 |
| 7 | 108.8 | 91.9 | 70,000 | 72,729 | 2,729 |
| 8 | 109.5 | 91.3 | 80,000 | 83,203 | 3,203 |
| 9 | 109.9 | 91.0 | 90,000 | 93,510 | 3,510 |
| 10 | 110.0 | 90.9 | 100,000 | 103,585 | 3,585 |
| 11 | 109.8 | 91.1 | 110,000 | 113,367 | 3,367 |
| 12 | 109.2 | 91.6 | 120,000 | 122,806 | 2,806 |
| 13 | 108.4 | 92.3 | 130,000 | 131,864 | 1,864 |
| 14 | 107.3 | 93.2 | 140,000 | 140,519 | 519 |
| 15 | 105.9 | 94.4 | 150,000 | 148,767 | -1,233 |
| 16 | 104.4 | 95.8 | 160,000 | 156,622 | -3,378 |
| 17 | 102.7 | 97.3 | 170,000 | 164,119 | -5,881 |
| 18 | 101.0 | 99.0 | 180,000 | 171,313 | -8,687 |
| 19 | 99.2 | 100.8 | 190,000 | 178,281 | -11,719 |
| 20 | 97.4 | 102.6 | 200,000 | 185,115 | -14,885 |
| 21. | 95.8 | 104.4 | 210,000 | 191,923 | -18,077 |
| 22 | 94.2 | 106.1 | 220,000 | 198,828 | -21,172 |
| 23 | 92.9 | 107.7 | 230,000 | 205,959 | -24,041 |
| 24 | 91.7 | 109.0 | 240,000 | 213,451 | -26,549 |
| 25 | 90.9 | 110.1 | 250,000 | 221,435 | -28,565 |
| 26 | 90.3 | 110.8 | 260,000 | 230,036 | -29,964 |
| 27 | 90.0 | 111.1 | 270,000 | 239,365 | -30,635 |
| 28 | 90.1 | 111.0 | 280,000 | 249,513 | -30,487 |
| 29 | 90.4 | 110.6 | 290,000 | 260,545 | -29,455 |
| 30 | 91.1 | 109.7 | 300,000 | 272,499 | -27,501 |
| 31 | 92.1 | 108.6 | 310,000 | 285,375 | -24,625 |
| 32 | 93.3 | 107.2 | 320,000 | 299,140 | -20,860 |
| 33 | 94.7 | 105.6 | 330,000 | 313,721 | -16,279 |
| 34 | 96.3 | 103.8 | 340,000 | 329,010 | -10,990 |
| 35 | 98.0 | 102.0 | 350,000 | 344,867 | -5,133 |
| 36 | 99.8 | 100.2 | 360,000 | 361,119 | 1,119 |
| The last value | 100.0 | 360,000 | 361,776 | 1,776 |
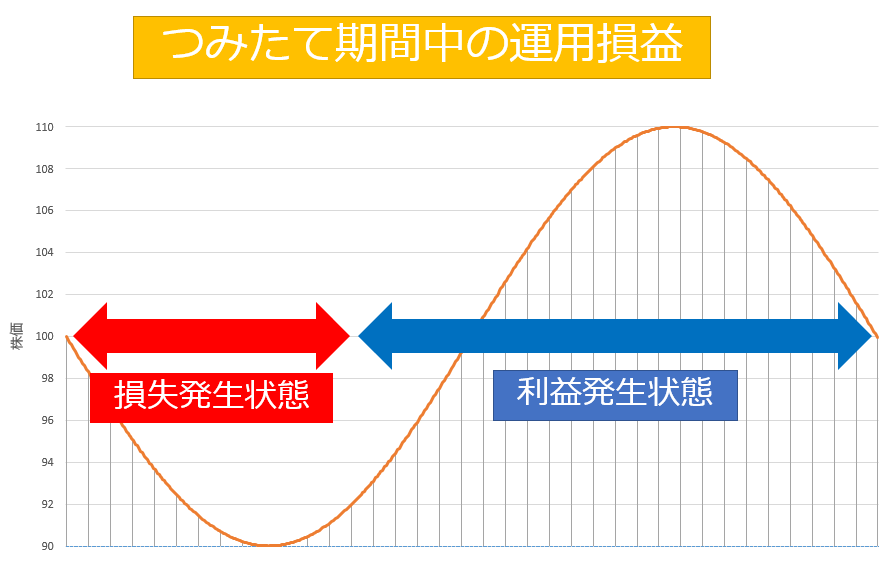
In the first ups and downs, we are profitable, but then if we fall a little past the peak, we are beginning to lose money. Profits have been positive in the end somehow, but the investment amount is about 0.5% of 360,000 yen. Because there is an error such as rounding at the time of calculation, it is good to think that the last plus is almost nothing.
When the profit and loss at the time of the build-up is reflected in the graph of the price movement, it looks like the following figure.
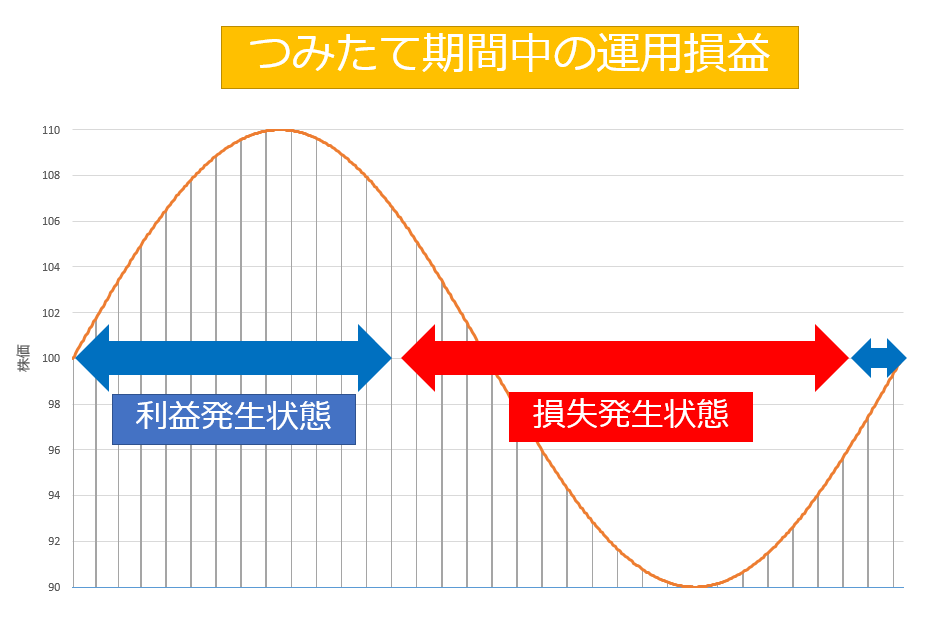
In fact, it will be painful in the feelings of the person who is investing because the operation situation is longer in the negative period than the positive period. In a phase that continues to decline, I think it is important to have a mental that continues to endure believing that it will return to the original stock price.
Even if you know that it is good because you can buy a lot of shares only when the stock price is going down, which is commonly said, if you see a large loss, you may not be able to wipe your anxiety and stop investing. However, if the stock price returns in the end in this way, stopping investment there is the worst possible scenario of the biggest loss.
Price Movement Pattern 2: Negative Sign Curve
As shown below, assume a price movement that is the reverse phase of the sine curve.
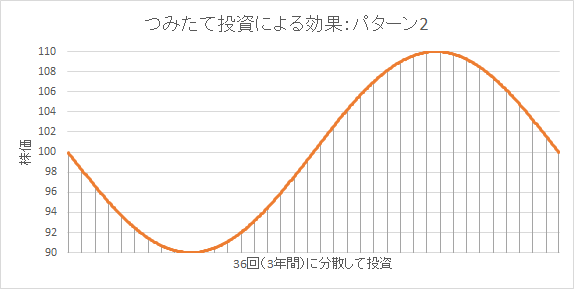
The following table summarizes the stock price at the time of each purchase of 36 times and the number of shares purchased accordingly.
| Number of purchases | Stock | Number of shares that can be bought for 10,000 yen | Amount of investment | Value of the rating | Income |
| 1 | 100.0 | 100.0 | 10,000. | 10,000. | 0 |
| 2 | 98.2 | 101.8 | 20,000 | 19,822 | -178 |
| 3 | 96.5 | 103.6 | 30,000 | 29,474 | -526 |
| 4 | 94.9 | 105.4 | 40,000 | 38,982 | -1,018 |
| 5 | 93.4 | 107.0 | 50,000 | 48,387 | -1,613 |
| 6 | 92.2 | 108.5 | 60,000 | 57,746 | -2,254 |
| 7 | 91.2 | 109.6 | 70,000 | 67,126 | -2,874 |
| 8 | 90.5 | 110.5 | 80,000 | 76,605 | -3,395 |
| 9 | 90.1 | 111.0 | 90,000 | 86,263 | -3,737 |
| 10 | 90.0 | 111.1 | 100,000 | 96,178 | -3,822 |
| 11 | 90.2 | 110.8 | 110,000 | 106,425 | -3,575 |
| 12 | 90.8 | 110.2 | 120,000 | 117,066 | -2,934 |
| 13 | 91.6 | 109.1 | 130,000 | 128,146 | -1,854 |
| 14 | 92.7 | 107.8 | 140,000 | 139,692 | -308 |
| 15 | 94.1 | 106.3 | 150,000 | 151,708 | 1,708 |
| 16 | 95.6 | 104.6 | 160,000 | 164,172 | 4,172 |
| 17 | 97.3 | 102.8 | 170,000 | 177,037 | 7,037 |
| 18 | 99.0 | 101.0 | 180,000 | 190,234 | 10,234 |
| 19 | 100.8 | 99.2 | 190,000 | 203,668 | 13,668 |
| 20 | 102.6 | 97.5 | 200,000 | 217,228 | 17,228 |
| 21 | 104.2 | 95.9 | 210,000 | 230,786 | 20,786 |
| 22 | 105.8 | 94.5 | 220,000 | 244,204 | 24,204 |
| 23 | 107.1 | 93.3 | 230,000 | 257,342 | 27,342 |
| 24 | 108.3 | 92.4 | 240,000 | 270,058 | 30,058 |
| 25 | 109.1 | 91.6 | 250,000 | 282,219 | 32,219 |
| 26 | 109.7 | 91.1 | 260,000 | 293,703 | 33,703 |
| 27 | 110.0 | 90.9 | 270,000 | 304,408 | 34,408 |
| 28 | 109.9 | 91.0 | 280,000 | 314,254 | 34,254 |
| 29 | 109.6 | 91.3 | 290,000 | 323,188 | 33,188 |
| 30 | 108.9 | 91.8 | 300,000 | 331,188 | 31,188 |
| 31 | 107.9 | 92.7 | 310,000 | 338,262 | 28,262 |
| 32 | 106.7 | 93.7 | 320,000 | 344,454 | 24,454 |
| 33 | 105.3 | 95.0 | 330,000 | 349,842 | 19,842 |
| 34 | 103.7 | 96.5 | 340,000 | 354,534 | 14,534 |
| 35 | 102.0 | 98.1 | 350,000 | 358,670 | 8,670 |
| 36 | 100.2 | 99.8 | 360,000 | 362,418 | 2,418 |
| The last value | 100.0 | 360,000 | 362,418 | 1,760 |
We lost in the first phase of the decline, but when we recover after that, we are starting to make a profit. As with Pattern 1, the final investment amount is about 0.5% positive for 360,000 yen.
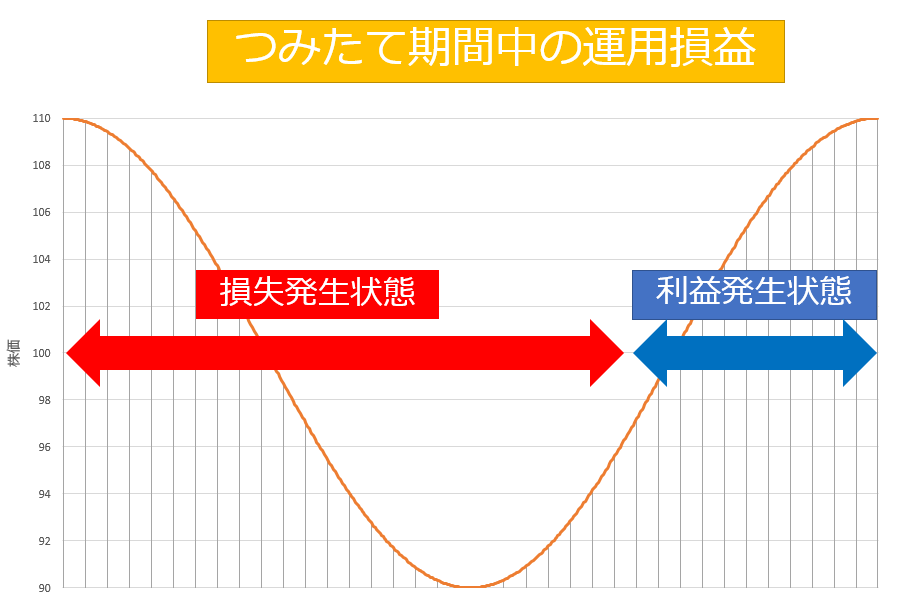
When the profit and loss at the time of the build up is reflected in the graph of the price movement, it looks like the following figure.
In the first phase of stock price sinking, even if the stock price does not return to 100 yen, the operating situation has been positive from the part of about 93 yen. It can be said that this is a big effect by the build up.
If the price eventually declines to the original stock price, you won’t get much profit, but if the stock price can sell near its peak, you’ll get a big profit.
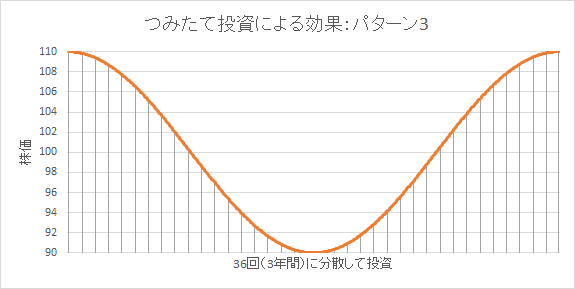
Price Movement Pattern 3: Cosine Curve
Let’s assume the case of the price movement which becomes a cosine curve as shown below.
The following table summarizes the stock price at the time of each purchase of 36 times and the number of shares purchased accordingly.
| Number of purchases | Stock | Number of shares that can be bought for 10,000 yen | Amount of investment | Value of the rating | Income |
| 1 | 110.0 | 90.9 | 10,000. | 10,000. | 0 |
| 2 | 109.8 | 91.0 | 20,000 | 19,985 | -15 |
| 3 | 109.4 | 91.4 | 30,000 | 29,899 | -101 |
| 4 | 108.6 | 92.1 | 40,000 | 39,688 | -312 |
| 5 | 107.5 | 93.0 | 50,000 | 49,305 | -695 |
| 6 | 106.3 | 94.1 | 60,000 | 58,714 | -1,286 |
| 7 | 104.8 | 95.5 | 70,000 | 67,891 | -2,109 |
| 8 | 103.1 | 97.0 | 80,000 | 76,827 | -3,173 |
| 9 | 101.4 | 98.6 | 90,000 | 85,530 | -4,470 |
| 10 | 99.6 | 100.4 | 100,000 | 94,024 | -5,976 |
| 11 | 97.8 | 102.2 | 110,000 | 102,350 | -7,650 |
| 12 | 96.1 | 104.0 | 120,000 | 110,568 | -9,432 |
| 13 | 94.5 | 105.8 | 130,000 | 118,752 | -11,248 |
| 14 | 93.1 | 107.4 | 140,000 | 126,987 | -13,013 |
| 15 | 92.0 | 108.8 | 150,000 | 135,371 | -14,629 |
| 16 | 91.0 | 109.9 | 160,000 | 144,004 | -15,996 |
| 17 | 90.4 | 110.6 | 170,000 | 152,989 | -17,011 |
| 18 | 90.0 | 111.1 | 180,000 | 162,423 | -17,577 |
| 19 | 90.0 | 111.1 | 190,000 | 172,394 | -17,606 |
| 20 | 90.3 | 110.7 | 200,000 | 182,973 | -17,027 |
| 21 | 90.9 | 110.0 | 210,000 | 194,211 | -15,789 |
| 22 | 91.8 | 108.9 | 220,000 | 206,134 | -13,866 |
| 23 | 93.0 | 107.5 | 230,000 | 218,739 | -11,261 |
| 24 | 94.4 | 105.9 | 240,000 | 231,995 | -8,005 |
| 25 | 96.0 | 104.2 | 250,000 | 245,839 | -4,161 |
| 26 | 97.6 | 102.4 | 260,000 | 260,176 | 176 |
| 27 | 99.4 | 100.6 | 270,000 | 274,887 | 4,887 |
| 28 | 101.2 | 98.8 | 280,000 | 289,827 | 9,827 |
| 29 | 103.0 | 97.1 | 290,000 | 304,834 | 14,834 |
| 30 | 104.6 | 95.6 | 300,000 | 319,732 | 19,732 |
| 31 | 106.1 | 94.2 | 310,000 | 334,337 | 24,337 |
| 32 | 107.4 | 93.1 | 320,000 | 348,469 | 28,469 |
| 33 | 108.5 | 92.2 | 330,000 | 361,954 | 31,954 |
| 34 | 109.3 | 91.5 | 340,000 | 374,632 | 34,632 |
| 35 | 109.8 | 91.1 | 350,000 | 386,365 | 36,365 |
| 36 | 110.0 | 90.9 | 360,000 | 397,041 | 37,041 |
| The last value | 110.0 | 360,000 | 397,047 | 37,047 |
During the first half of the decline, losses increased to a maximum of 10% of the investment amount, but the subsequent recovery in stock prices resulted in a profit of about 10%.
When the profit and loss at the time of the build up is reflected in the graph of the price movement, it looks like the following figure.
When purchased in bulk for the first time, the stock price is always lower than the first value, so there is always a loss, but even if the stock price does not completely recover due to the effect of the build up, profit and loss has changed to positive at the stage of about 97 yen.
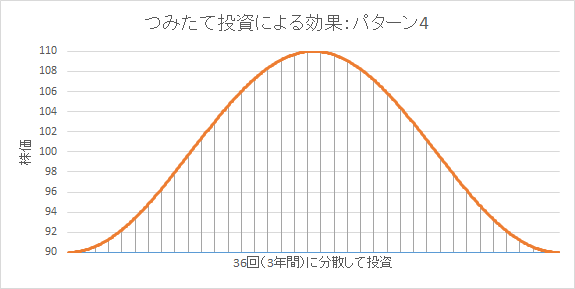
Price Movement Pattern 4: Minus Cosine Curve
Let’s assume a price movement that is the reverse phase of the cosine curve, as shown below.
The following table summarizes the stock price at the time of each purchase of 36 times and the number of shares purchased accordingly.
| Number of purchases | Stock | Number of shares that can be bought for 10,000 yen | Amount of investment | Value of the rating | Income |
| 1 | 90.0 | 111.1 | 10,000. | 10,000. | 0 |
| 2 | 90.2 | 110.9 | 20,000 | 20,018 | 18 |
| 3 | 90.6 | 110.3 | 30,000 | 30,123 | 123 |
| 4 | 91.4 | 109.4 | 40,000 | 40,380 | 380 |
| 5 | 92.5 | 108.2 | 50,000 | 50,843 | 843 |
| 6 | 93.7 | 106.7 | 60,000 | 61,552 | 1,552 |
| 7 | 95.2 | 105.0 | 70,000 | 72,530 | 2,530 |
| 8 | 96.9 | 103.2 | 80,000 | 83,780 | 3,780 |
| 9 | 98.6 | 101.4 | 90,000 | 95,286 | 5,286 |
| 10 | 100.4 | 99.6 | 100,000 | 107,011 | 7,011 |
| 11 | 102.2 | 97.9 | 110,000 | 118,900 | 8,900 |
| 12 | 103.9 | 96.3 | 120,000 | 130,882 | 10,882 |
| 13 | 105.5 | 94.8 | 130,000 | 142,872 | 12,872 |
| 14 | 106.9 | 93.6 | 140,000 | 154,775 | 14,775 |
| 15 | 108.0 | 92.6 | 150,000 | 166,492 | 16,492 |
| 16 | 109.0 | 91.8 | 160,000 | 177,923 | 17,923 |
| 17 | 109.6 | 91.2 | 170,000 | 188,970 | 18,970 |
| 18 | 110.0 | 90.9 | 180,000 | 199,546 | 19,546 |
| 19 | 110.0 | 90.9 | 190,000 | 209,576 | 19,576 |
| 20 | 109.7 | 91.2 | 200,000 | 219,000 | 19,000 |
| 21 | 109.1 | 91.7 | 210,000 | 227,779 | 17,779 |
| 22 | 108.2 | 92.5 | 220,000 | 235,899 | 15,899 |
| 23 | 107.0 | 93.5 | 230,000 | 243,366 | 13,366 |
| 24 | 105.6 | 94.7 | 240,000 | 250,217 | 10,217 |
| 25 | 104.0 | 96.1 | 250,000 | 256,512 | 6,512 |
| 26 | 102.4 | 97.7 | 260,000 | 262,338 | 2,338 |
| 27 | 100.6 | 99.4 | 270,000 | 267,807 | -2,193 |
| 28 | 98.8 | 101.2 | 280,000 | 273,049 | -6,951 |
| 29 | 97.0 | 103.0 | 290,000 | 278,218 | -11,782 |
| 30 | 95.4 | 104.8 | 300,000 | 283,476 | -16,524 |
| 31 | 93.9 | 106.5 | 310,000 | 288,998 | -21,002 |
| 32 | 92.6 | 108.0 | 320,000 | 294,961 | -25,039 |
| 33 | 91.5 | 109.3 | 330,000 | 301,539 | -28,461 |
| 34 | 90.7 | 110.3 | 340,000 | 308,893 | -31,107 |
| 35 | 90.2 | 110.9 | 350,000 | 317,172 | -32,828 |
| 36 | 90.0 | 111.1 | 360,000 | 326,496 | -33,504 |
| The last value | 90.0 | 360,000 | 326,490 | -33,510 |
Contrary to Pattern 3, profits of up to 10% of the investment amount were generated in the first half, but in the end there was a loss of less than 10%.
When the profit and loss at the time of the build up is reflected in the graph of the price movement, it looks like the following figure.
When purchasing in bulk, the operating profit and loss is positive because it always has a higher value than the first stock price, but in the build up, the profit and loss are negative at the stage where the stock price is about 101 yen.
Summary
In order to verify the effect of build up investment (time variance) (dollar cost average method), I examined the patterns of four price movements using tri-functions.
In this four patterns where the first and last stock prices are the same, focusing only on the final profit and loss results in the following results:
| Final gains and losses | |
| Pattern 1 | 1,776 |
| Pattern 2 | 1,760 |
| Pattern 3 | 37,047 |
| Pattern 4 | -33,510 |
Considering the expected value as these four patterns occur with an equal probability, the profit and loss will be +1,768 yen for the case of the build-up purchase. Considering the ratio of the investment amount of 360,000 yen, it is only about 0.5%, and considering that it also includes errors such as rounding at the time of calculation, it is not considered to be a big difference. From the results of the previous article, I have found that there is no significant difference in expectations when comparing bulk purchases.
The most convenient scenario for a fresh case is the price movement that rises after falling like pattern 3. In order to make the most of such a sharp effect, it is not to quit because it is scared in the falling phase. It is important to think of the decline as an opportunity to prepare for a subsequent backlash. Even if it does notrecover to the original stock price after the decline phase, you will understand in this illustration that the operating profit and loss will be positive if it recovers even a little.