I analyze the infection status independently using the open data of the new COVID-19 published by Gunma Prefecture. The information resource is “Gunma Prefecture New COVID-19 Infectious Disease Control Site Latest Infection Trends in Gunma Prefecture (http://stopcovid19.hf.gunma.jp/)[2020/7/28 access].
Changes in the number of people infected and the number of tests
A graph of the daily infection (positive person) and the number of tests and the percentage of positives to the number of tests (positive rate) from March 15 to July 28, 2020 is as follows:
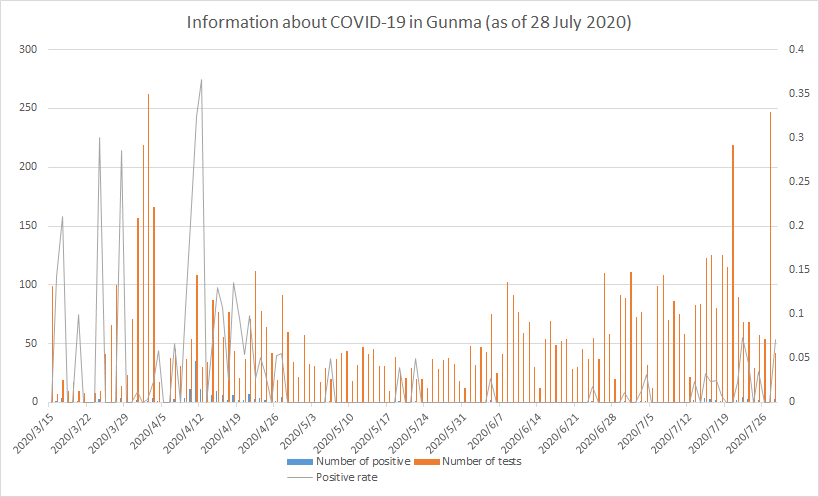
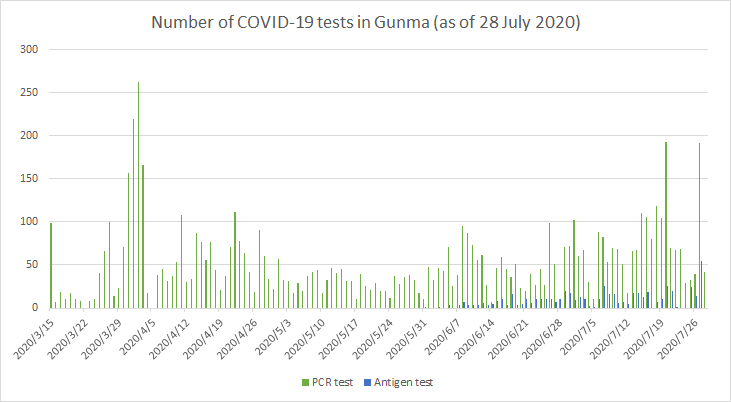
The number of tests here shows the total number of PCR and antigen tests. Although antigen testing is less accurate, the following graph shows that the rate of antigen testing is gradually increasing because it can be done in a short time.
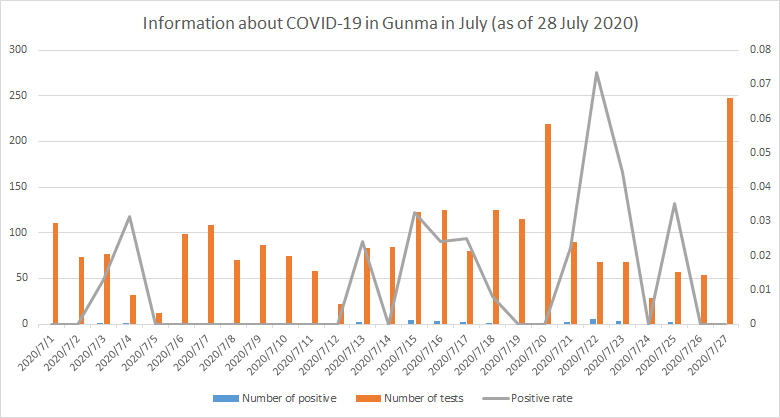
The traffic situation in Gunma in July is shown in the graph below. The positive rate seems to be getting higher in late July, but I don’t think this is a big change. Since the middle of July, the number of people infected in Tokyo has increased, and concerns about the second wave have been causing a stir, but the positive rate is still less than 0.1 in Gunma. Compared to the peak in mid-April, the infection is not likely to spread so much. In addition, since it is easier to grasp information such as infection route, it is even more so considering that the subject of the test is also more carefully selected than before.
I would like to analyze the infection situation using the latest information in the future.